General Remarks and Findings
As we have reached the official end of the funding of the H3D project as ISPRS scientific initiative, we, the H3D team, would like to share some of our findings based on the results so far. Please note, that submission to the H3D benchmark is still open and will be kept open until further notice.
Despite the fact that H3D provides high resolution 3D point clouds and meshes for multiple epochs, almost all results for the test set were delivered for the epoch March 2018 (probably due to availability of plenty results to compare with). In this regard the majority of submissions focuses on the point cloud modality, which is why we limit our discussion to this use case. Additionally, we observed that many participants employ their respective model either on derived voxelizations or on the subsampled data set emphasizing the challenges with regard to computation complexity for such high-density data.
|
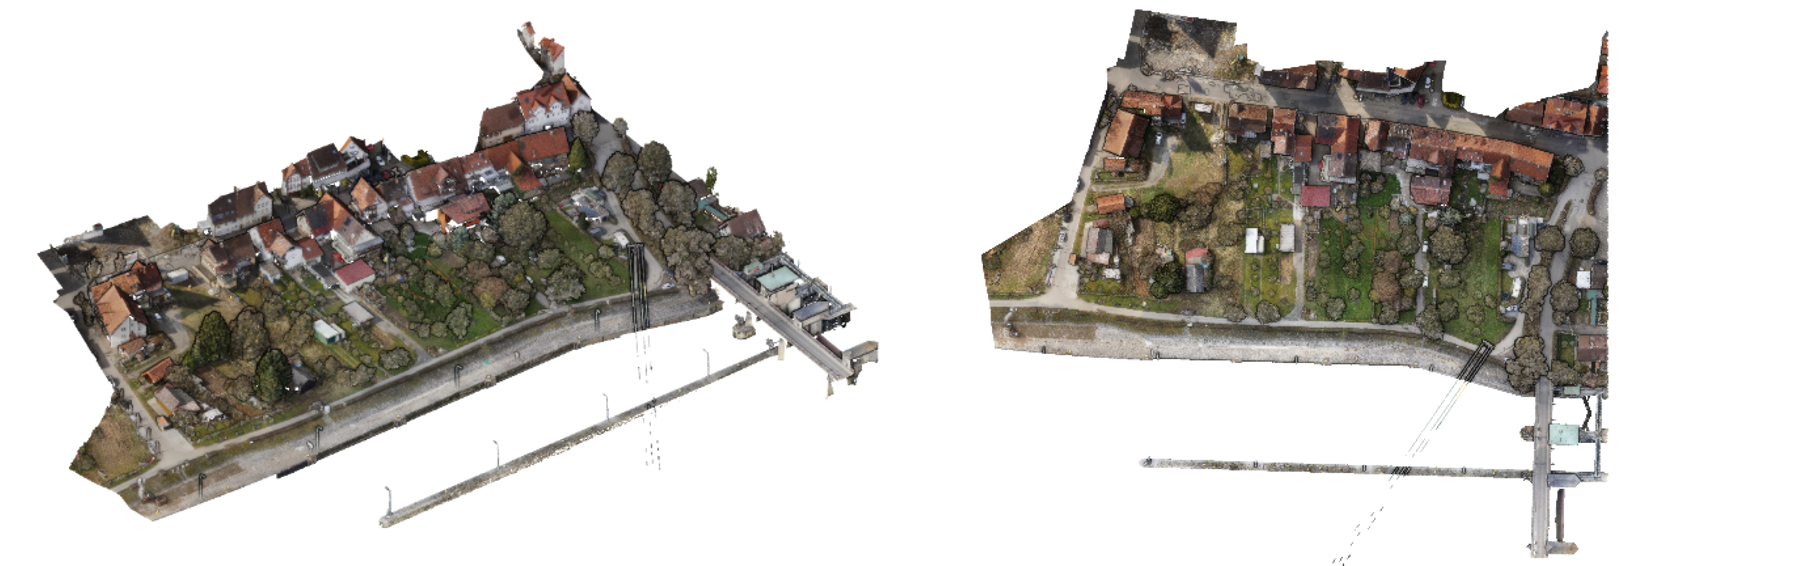
RGB point cloud for test set of H3D(PC), epoch March 2018
|
While measures like Overall Accuracy, mean F1 score, confusion matrix as well as detailed information on the respective submissions can be found in the results section, our findings and outcomes aim to give a high-level summary of obtained results.
First of all, a comparison of all submitted results to the ground truth shows that for 0.9% of all test points none of the submissions matches Ground Truth (GT) data. We may consider this as indicator of accuracy of our reference data, also underlining that generating error-free ground truth data is a challenging endeavor.
|
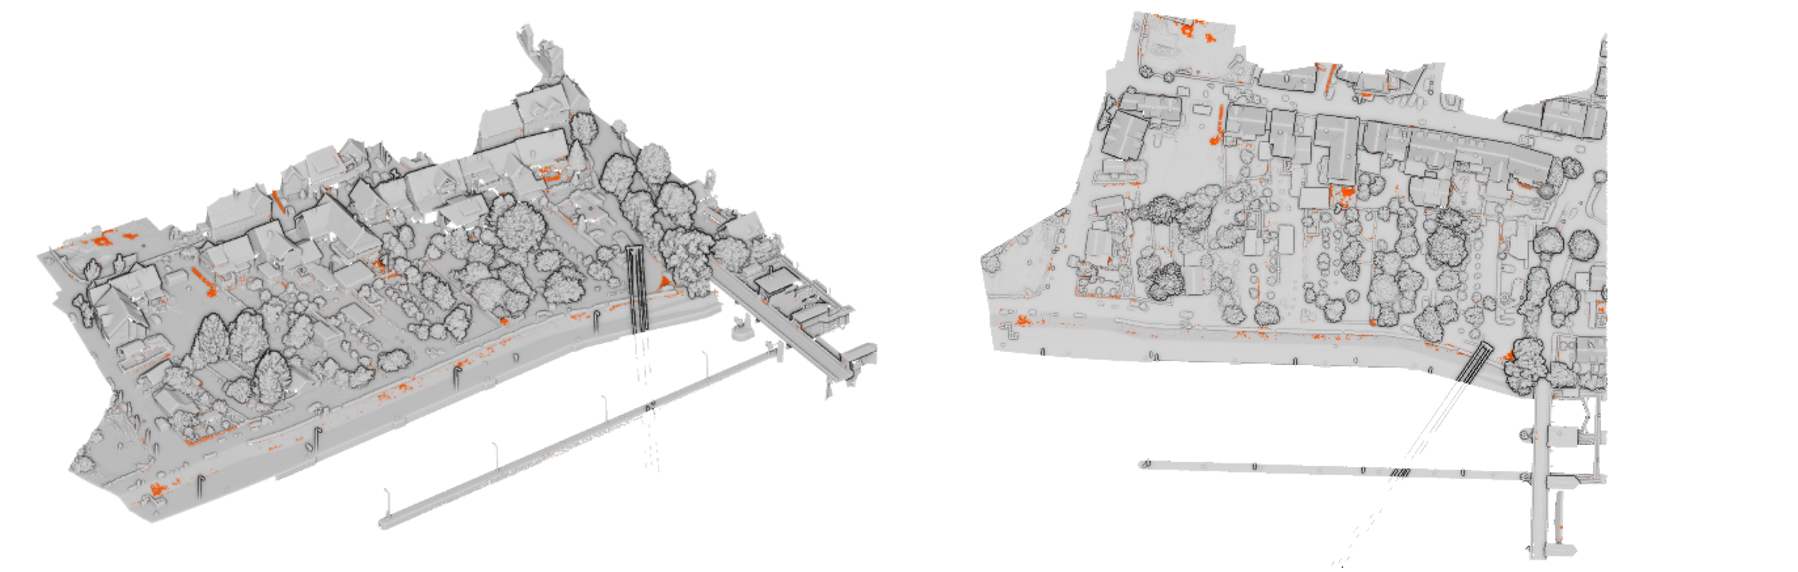
Shaded test split (epoch March 2018) along with indication of areas where none of the submitted results matches GT, colored in orange.
|
The best submission for the time being gives an Overall Accuracy of 82.81% and a mean F1 score of 91.77%. The combination of all results submitted to the benchmark by simple majority voting results in an Overall Accuracy of 82.17% and a mean F1 score of 89.64%.
From our point of view, this can be interpreted as a clear proof of success of the Wisdom of the Crowds idea and the benefit of ensemble learning, respectively.
|
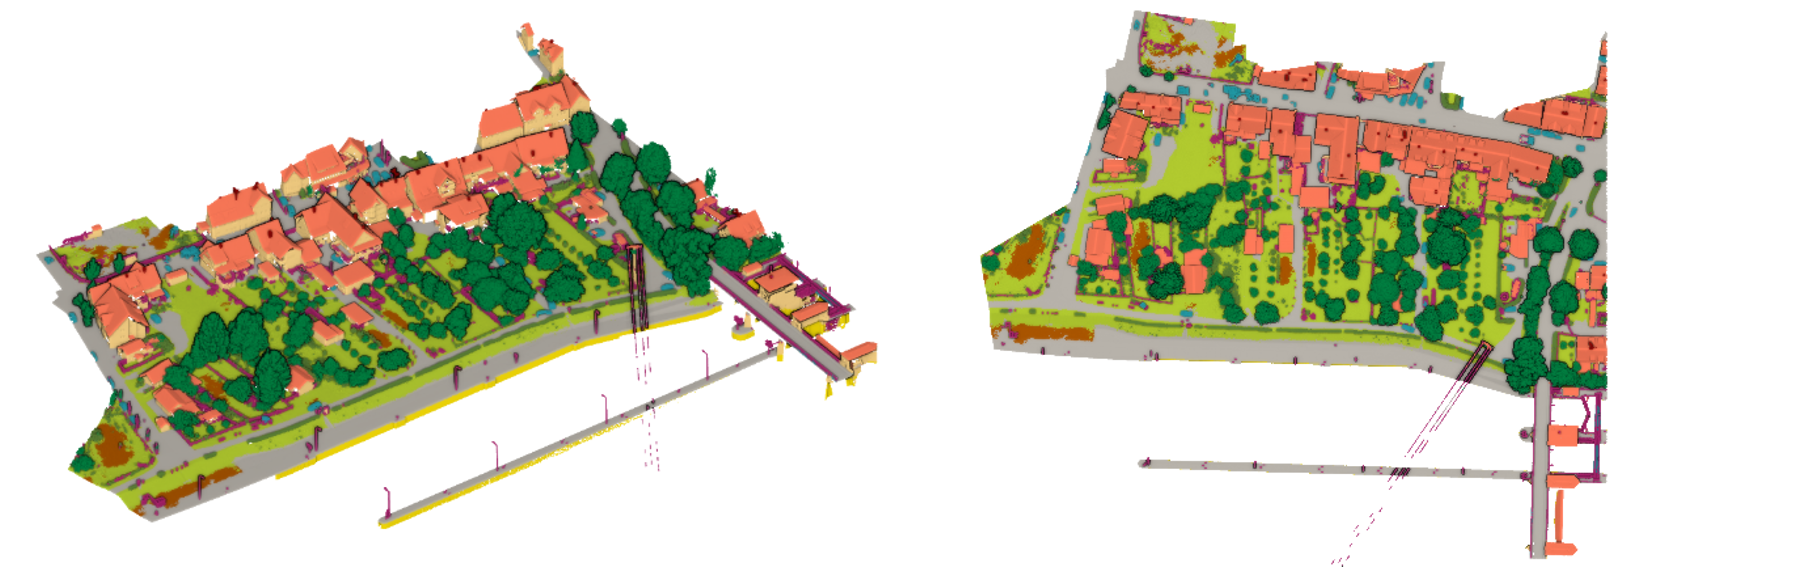
Majority Voting from all submitted classifications (epoch March 2018)
|
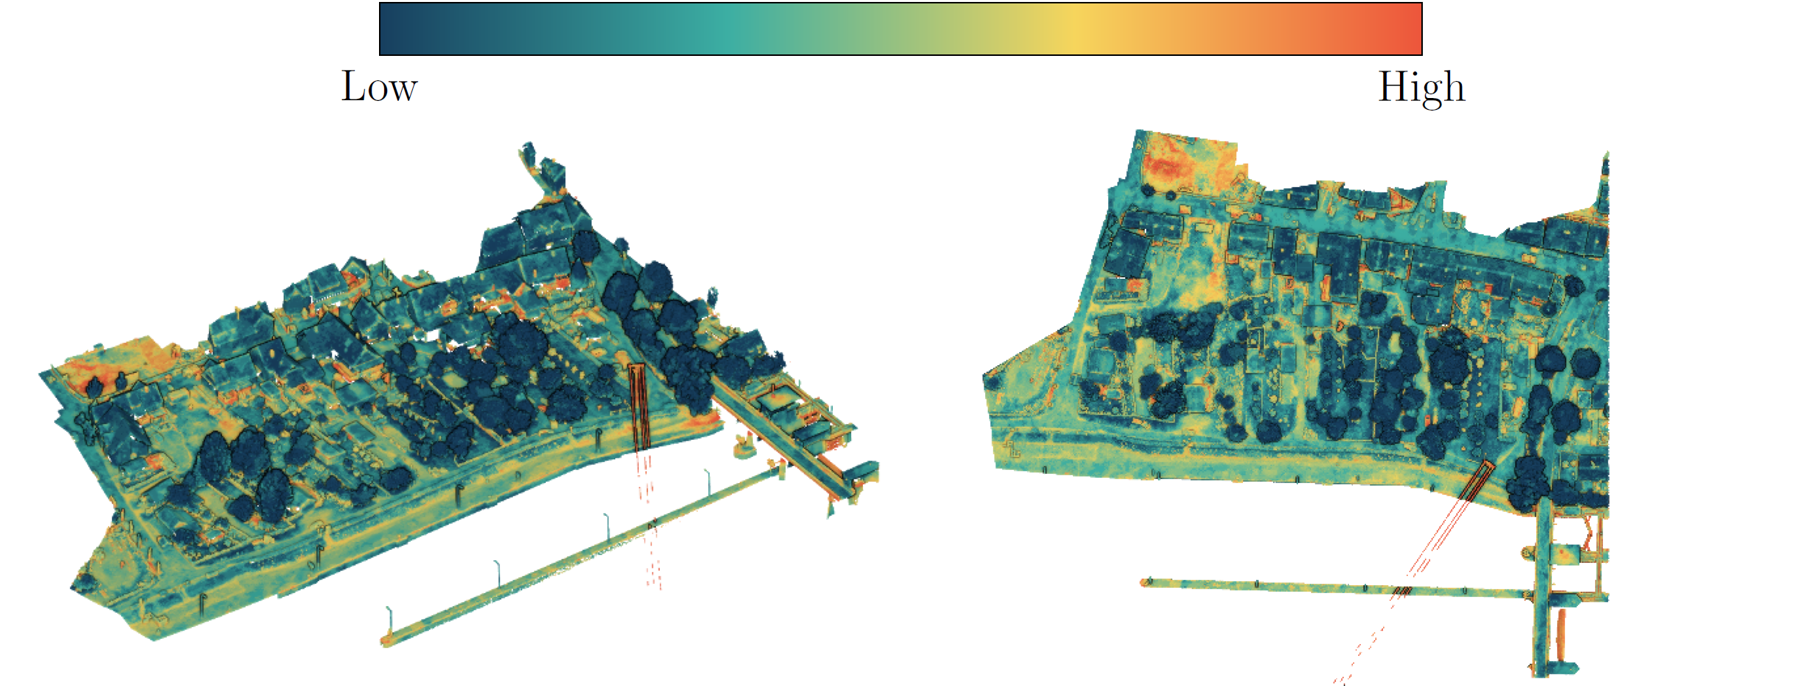
While the maximum possible classification accuracy for H3D is about 90%, it is worth highlighting most challenging regions and classes. For this purpose the submitted results can be used to compute a “per-point variance” expressed by entropy (computed over the pseudo class distribution generated from “votes” of submissions) to identify parts of the test area, which were easy to be classified (i.e., same class provided by all submissions) or more challenging (i.e., different classes provided by all submissions).
|
Entropy from all submitted classifications (epoch March 2018)
|
Most Demanding Classes
Transferring this information to generate individual class-complexity-scores, we compute the mean class-wise entropy and mark most difficult classes in the following Table in red, while easiest classes are depicted in blue. This ranking corresponds well to human interpretation complexity, especially for classes Urban Furniture due to a high intra-class variability and for Gravel being demanding to separate from class Low Vegetation. Class Chimney on the other hand mainly suffers from only few available training points in this highly class-imbalanced point cloud.
Interpretation complexity of H3D’s classes. Easiest classes are marked blue while most challenging classes are highlighted red.
Class |
Ranking based on mean entropy |
Low Vegetation |
9 |
Impervious Surface |
7 |
Car |
4 |
Urban Furniture |
1 |
Roof |
10 |
Facade |
8 |
Shrub |
5 |
Tree |
11 |
Gravel |
2 |
Vertical Surface |
6 |
Chimney |
3 |
Some Particularly Difficult Spots
In the following, we simply aim to give some examples for regions in H3D’s test data (epoch March 2018) that seem to be prone to classification errors.
Example 1: Class Gravel can be a matter of definition.
Example 2: Both classes Gravel & Vertical Surface can be challenging, although being easily separable for the human eye in this example.
Example 3: Some cars, especially trucks might be mistaken as buildings. Furthermore, correctly identifying “facade furniture” found on balconies etc. can be demanding.