Data Set(s)
|
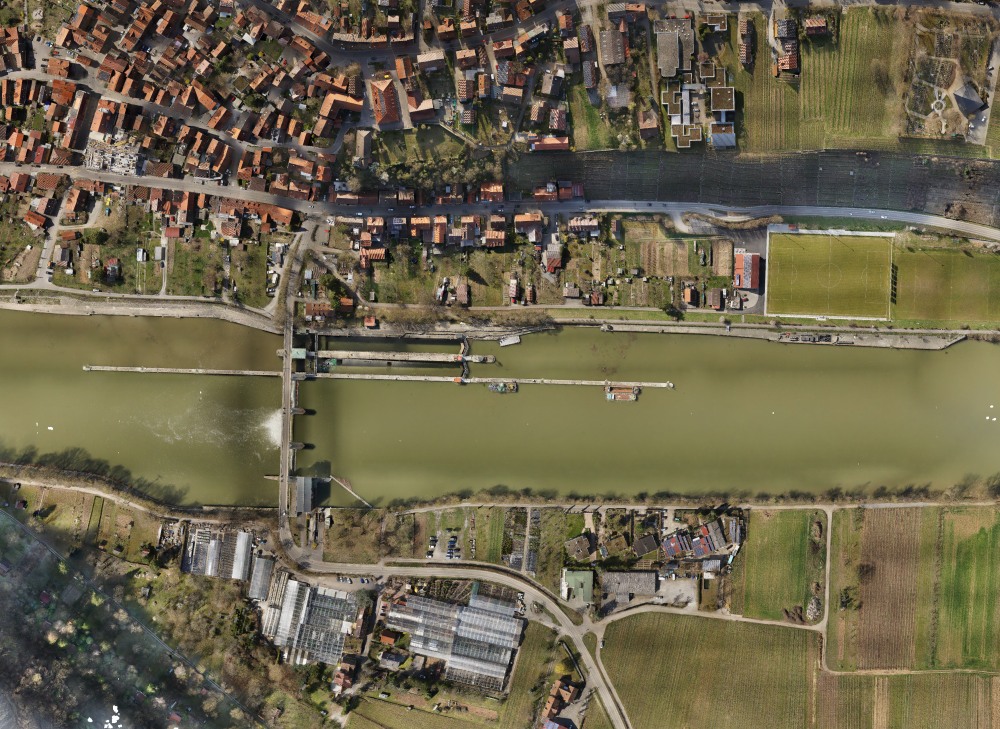
Figure 1: Our area of interest captures the village of Hessigheim in Germany.
|
Imagery and LiDAR data for H3D were originally captured in a joint project between the University of Stuttgart and the German Federal Institute of Hydrology (BfG) for detecting ground subsidence in the domain of sub-mm accuracy. For this monitoring application, the area of interest which is the village of Hessigheim, Germany (see Figure 1), was surveyed at multiple epochs in March 2018, November 2018, and March 2019. The process of high precision alignment and georeferencing of imagery and LiDAR data, which is also mandatory for joint semantic evaluation, is described in (Cramer et. al., 2018) and (Haala et. al., 2020). In all three epochs, our sensor setup is constituted of a Riegl VUX-1LR Scanner and two oblique-looking Sony Alpha 6000 cameras integrated on a RIEGL Ricopter platform. Considering a height above ground of 50 m, we achieved a laser footprint of less than 3 cm and a Ground Sampling Distance for the cameras of 1.5-3 cm. Georeferencing of acquired LiDAR strips of this highly dense LiDAR point cloud with 800 pts/m² is accomplished using the OPALS software (Pfeifer et.al., 2014). Both the LiDAR data and the imagery were additionally georeferenced by a hybrid adjustment (Haala, et.al., 2020). The 3D textured mesh was generated by the SURE software (Rothermel et al., 2012), which integrated the LiDAR data to its Multi-View-Stereo image matching pipeline. Both data types are visualized in Figure 2.
|
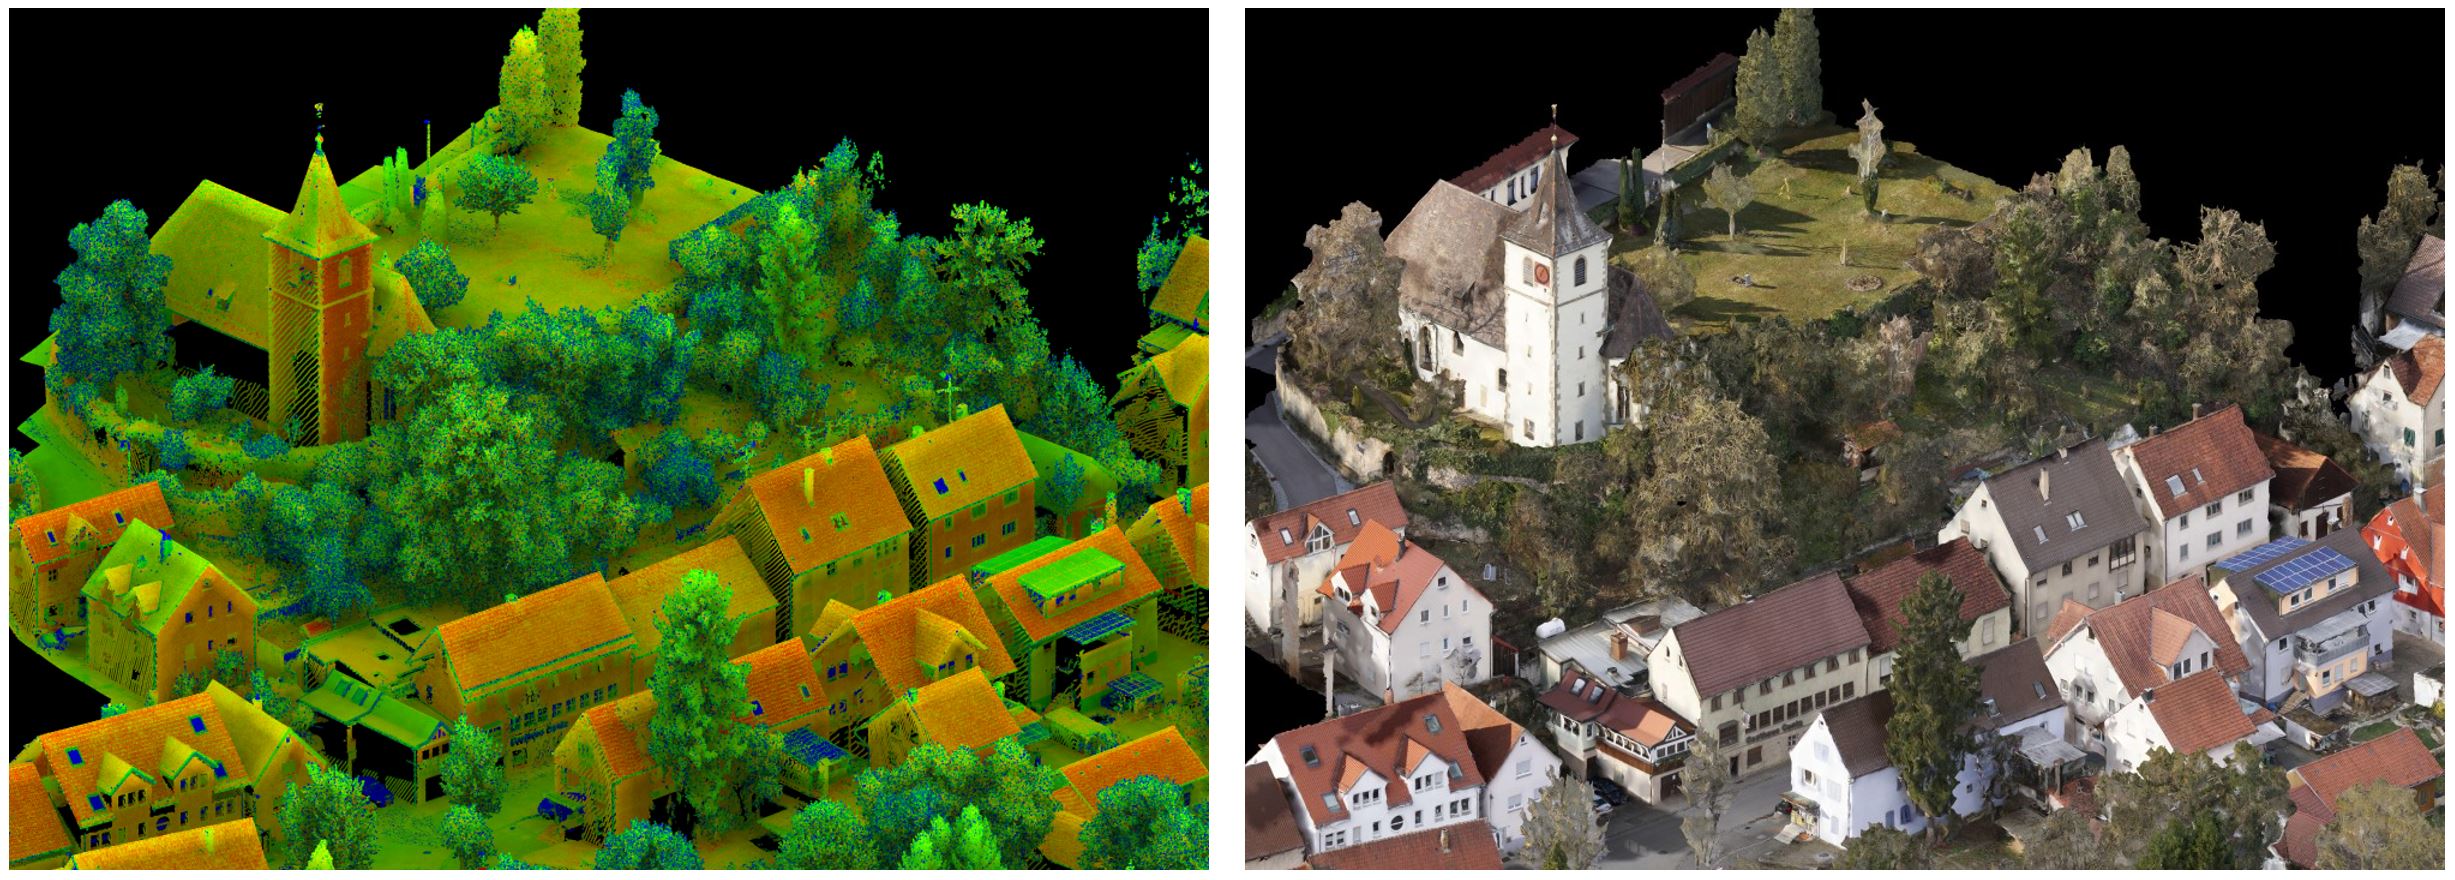
Figure 2: Exemplary data of our proposed benchmark. The high resolution LiDAR data H3D(PC) (left; coloured according to Reflectance) will be manually annotated and labels will be transferred to the 3D textured mesh H3D (Mesh) (right).
|
3D Point Cloud. Apart from the XYZ coordinates of each point, LiDAR-inherent features such as the echo number, number of echoes, and reflectance were measured. The latter is derived by range correction of the raw intensity measurement by RIEGL. The LiDAR point cloud is furthermore colorized by transferring colors from the textured mesh. Additionally, we provide a class label for every point (classes will be discussed in section 3). As exchange format of data both plain ASCII files and Las files are provided.
3D Textured Mesh. We generate the 3D mesh by utilizing software SURE from nFrames (Rothermel et al., 2012). The geometric reconstruction is based on both LiDAR data and multi-view stereo-image matching (using the oblique Sony imagery) to benefit from the complementary information and thus achieve better completeness. These oblique images also provide texture for the resulting meshes and thus guarantee good texturing of vertical faces, e.g. facades (see Figure 2). Since manual labeling is very time‑consuming, we opt for semi-automatic labeling of the textured mesh with the manual annotations being transferred automatically from the point cloud to the mesh (see Generating Ground Truth (GT) Data). The mesh data is provided in a tiled manner. Each tile is provided both as plain ASCII file (.txt) and Wavefront OBJ (.obj) file. The plain ASCII files provide the centers of gravity (CoGs) for each face along with the transferred label. The .obj files are delivered in a textured and labeled fashion.
Generating Ground Truth (GT) Data
Point Cloud Labeling: Manual Annotation. The main focus of H3D is to provide labeled multi-temporal and multi-modal data sets for training and evaluation of machine learning systems aiming at semantic point cloud segmentation. For point cloud labeling, we established a manual process carried out by student assistants resulting in an annotation as depicted in Figure 3. This classification was generated by extracting point cloud segments of unique class affiliation (i.e. the point cloud is cut into many small subsets of homogeneous class membership) and segments of each class are afterwards merged to form the semantic segmentation by the usage of the CloudCompare software (CloudCompare, 2020).
|
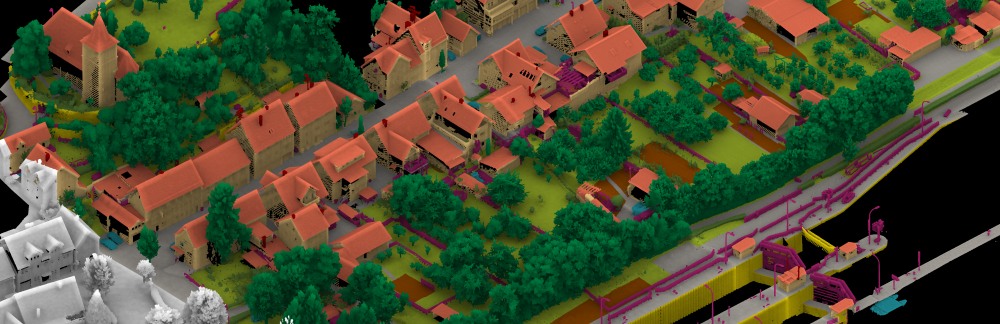
Figure 3: Detailed view of labels already available for epoch March 2018.
|
For the March 2018 data set, we manually generated reference labels for differentiating 11 classes (see also Figure 3):
| C00 |
Low Vegetation |
| C01 |
Impervious Surface |
| C02 |
Vehicle |
| C03 |
Urban Furniture |
| C04 |
Roof |
| C05 |
Facade |
| C06 |
Shrub |
| C07 |
Tree |
| C08 |
Soil/Gravel |
| C09 |
Vertical Surface |
| C10 |
Chimney |
Quality control is accomplished in a two-stage procedure. First, student assistants checking each other’s labels and finally, the applicants check the labels as last instance. However, we want to stress, that despite a careful quality control, we will not be able to completely avoid label noise.
Mesh Labeling: Automatic Transfer of Point Cloud Labels to the 3D Mesh. Since manual labeling is very time‑consuming, we opt for semi-automatic labeling of the textured mesh for each epoch. The manual point cloud annotations will be transferred automatically by a geometric-driven approach that associates the representation entities points and faces (Laupheimer et.al., 2020). Therefore, the mesh inherits the class catalogue of the manually labeled point cloud. In comparison to the point cloud representation, the mesh is an efficient non-uniform representation requiring only a small number of faces to represent flat surfaces. For this reason, the number of faces is significantly smaller than the number of LiDAR points. Consequently, several points are commonly linked to the same face. Hence, the per-face label is determined by majority vote. However, due to structural discrepancies, some faces remain unlabeled because no points can be associated to them (e.g. absence of LiDAR points or geometric reconstruction errors). These faces are marked by the class label -1. With the help of the labeled mesh data, we want to i) foster semantic mesh segmentation and ii) evaluate the community’s interest in this kind of representation at the same time. Our mesh labeling by semi-automatic label transfer from the point clouds will also provide insights on the need for manual refinement during potential future extensions of the benchmark while limiting the effort for the time being.
H3D Epochs
This section provides detailed peculiarities on the different epochs of H3D
- March 2018 covers an area of smaller spatial extent compared to the other epochs (see Figure XX), which was due to limited labeling resources at this time. However, we refrained from extending the area for consistency reasons with already submitted results.
- November 2018 covers the full area. Please note that during the campaign serious fog was present resulting in numerous fog points in air due to reflections from aerosols. For the benchmark dataset, those points were filtered out but multi-echo readings of data points are still impacted. Thus, some points expected to represent first pulses have an echo number > 1.
- March 2019 covers the full area and is supposed to reflect data obtained under close-to-optimal flight conditions.
- March 2016 covers the full area but underlies a different sensor configuration than the other epochs (since it was captured on behalf of the national mapping agency of Baden-Württemberg). A manned platform was employed for carrying a Riegl LMS-Q780 scanner at a height above ground of 600 m and an effective field of view of ± 20° (±70° was used for the UAV-based epochs) was selected. The mean point density is about 20 pts/m². This configuration leads to scarce depiction of vertical surfaces due to the Nadir-like measuring perspective. Instead of Reflectance, only pure intensity values of received echos were stored. Since no concurrently captured imagery is available for this epoch, no 3D mesh could be derived. Nevertheless, we colorized the point cloud by orthogonal projection of an orthophoto also received from the national authorities. The orthophoto was acquired using a DMC II 140 camera configured to achieve a ground sampling distance of 20 cm and was taken on June 11, 2017.
More Information
More information can also be found on the accompanying paper The Hessigheim 3D (H3D) Benchmark on Semantic Segmentation of High-Resolution 3D Point Clouds and Textured Meshes from UAV LiDAR and Multi-View-Stereo.