 |
|
Benchmark on
High Density Aerial Image Matching |
 |
Background and Scope of the project
Innovations in matching algorithms as well as the increasing quality of digital airborne cameras considerably improved the quality of elevation data generated automatically from aerial images. This development motivated the launch of the joint ISPRS/EuroSDR project “Benchmark on High Density Aerial Image Matching” aiming at evaluating the potential of photogrammetric 3D data capture in view of the ongoing developments of software for automatic image matching. Basic scope is the evaluation of 3D point clouds and DSM produced from aerial images with different software systems. Such a comparative evaluation provides a platform for software developers to demonstrate the state-of-the-art of their ongoing developments. Furthermore, it can help potential users like National Mapping and Cadastral agencies (NMCAs), which consider a state-wide-generation of high quality DSMs to understand the applicability of such tools while triggering further developments based on their needs.
As a joint test data set subsets of three aerial image blocks are provided. Two data sets cover nadir imagery, which are captured at different landuse and block geometry, while the third data set includes oblique aerial images.
Access to the data is provided by a ftp-server hosted by the Institute for Photogrammetry. After the participant has filled out the registration form including a signed user agreement, the password will be provided by mail from the point of contact.
ISPRS/EuroSDR Project Group Dense Image Matching
c/o Prof. Dr.-Ing. Norbert Haala
Institute for Photogrammetry
Geschwister-Scholl-Str. 24D
70174 Stuttgart
Phone : +49-711-685-83383
Fax : +49-711-685-83297
Norbert.Haala@ifp.uni-stuttgart.de
Processing parameters
General focus of the benchmark is the comparison of dense multi-stereo matching results as produced by different participants and/or software systems. For evaluation, DSM raster have to be generated for the nadir image blocks while the investigations for the obliqe image block are based on generated 3D point clouds. To allow for comparable results of dense image matching, it is absolutely essential that all the processing is based on the same image orientation. Participants therefore should use the provided orientation, with no modification. For each project corresponding image and ground coordinates are provided on demand so the proper use of the transformations can be controlled by the participants on their own.
Oblique Airborne Test
The collection and use of oblique imagery for photogrammetric purposes has become increasingly important. As an example, oblique images are integrated in global map services, such as Google Maps, where they are used for visualization but also for 2.5D or 3D information extraction. Airborne oblique views depict facades and footprints of buildings. Thus dense image matching offers a great potential for the automatic extraction of urban 3D models. However, applying dense matching algorithms to oblique imagery introduces some additional challenges. Examples are greater changes in viewpoint to object distances also resulting in increasing differences in object scale, or larger variations in viewing directions, which induce larger changes in radiometry. Furthermore multiple occlusions occur especially for dense urban environments.
The oblique image block to be used during the test was acquired over the city of Zürich with the medium format camera Leica RCD30 Oblique Penta which features a pixel size of 6 µm and a radiometric resolution of 14 bit. Imagery is captured in a maltese cross configuration, i.e. with one nadir and four oblique cameras. Nadir imagery is captured with a GSD of 6 cm and an approximate overlap of 70% in flight and 50% across flight direction. The imagery of the four oblique views mounted at tilt angle of 35° has a GSD of 6-13 cm.
|
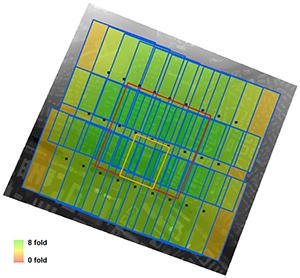
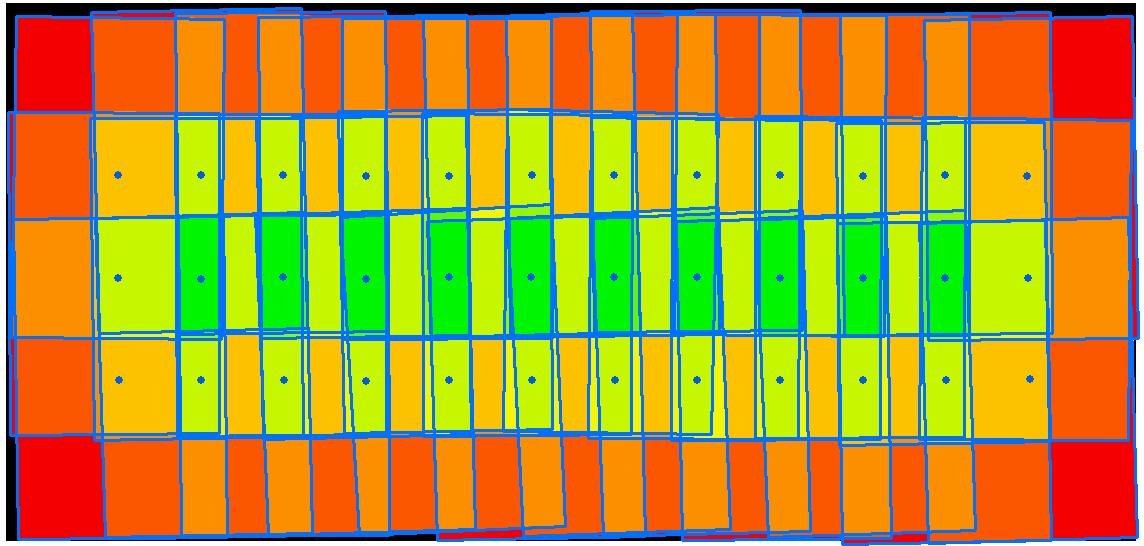
| Figure 1: Block configuration with camera stations, nadir image footprints, and nadir overlap (maximum eight-fold) overlaid to the DSM
|
The block configuration for the test area is given in figure 1, which shows the camera stations as blue dots overlaid to the DSM. For reason of simplicity, the image footprints depicted as blue polygons relate to the nadir camera only. The same holds true for the image overlap as represented by the color coded map. Nevertheless, for each camera station all 5 views are available. Thus, the sub-block to be used in the test consists of 3 strips, each with 9 camera stations, which again provides 5 views each. This results in a total of 3x9x5=135 images
Orientation parameters and deliverables
The images with 9000 x 6732 pixels each are free of lens distortion. They are made available as RGB 16 bit tiff data set together with the corresponding interior and exterior orientation parameters. To allow for comparable results, participants should use the orientation parameters as provided with no modification.
The test area is represented in figure 1 by the red polygon. This square area with a length and width of approximately 540 m is oriented parallel to the image block. The respective UTM coordinates are:
| north-west (upper left) |
463950 5249400 |
| north-east (upper right) |
464450 5249200 |
| south-east (lower right) |
464250 5248700 |
| south-west (lower left) |
463750 5248900 |
For simplification the area of interest for which the matching results should be provided has been reduced to the orange polygon with the following UTM coordinates:
| north-west (upper left) |
464000 5249090 |
| north-east (upper right) |
464200 5249010 |
| south-east (lower right) |
464100 5248760 |
| south-west (lower left) |
463900 5248840 |
As it is visible in figure 1, the block is not exactly oriented in east-west direction. The deviation is approximately 20°. Nevertheless, still the terms North, South, East and West are used while referring to the look direction of the respective oblique imagery with respect to the block orientation. Only those images are provided, which actually depict the test area. Depending on the viewing direction, this can result in different flight lines and thus different image numbers, which were selected according to the respective time stamp.
Within the respective directories, images and orientation files are arranged according to their respective look direction. As an example, for the viewing direction South two stripes where flown in West-East and one in East-West direction. Thus except for the nadir images the images relate to two different cameras heads. This is reflected by different camera directions and numbers. The following tables summarize the available images.
Viewing direction South |
|
|
|
|
|
|
|
|
|
Camera
direction |
Camera
number |
Flight
line |
Time stamp = image number |
|
|
|
|
|
Right |
61010 |
25 |
121239 |
121241 |
121243 |
121245 |
121247 |
121248 |
121250 |
121252 |
121254 |
Left |
61007 |
26 |
121538 |
121535 |
121533 |
121530 |
121528 |
121525 |
121523 |
121521 |
121518 |
Right |
61010 |
27 |
121945 |
121947 |
121949 |
121952 |
121954 |
121956 |
121959 |
122001 |
122003 |
Viewing direction North |
|
|
|
|
|
|
|
|
|
Camera
direction |
Camera
number |
Flight
line |
Time stamp = image number |
|
|
|
|
|
Left |
61007 |
27 |
121945 |
121947 |
121949 |
121952 |
121954 |
121956 |
121959 |
122001 |
122003 |
Right |
61010 |
28 |
122316 |
122313 |
122311 |
122309 |
122306 |
122304 |
122301 |
122259 |
122257 |
Left |
61007 |
29 |
122657 |
122659 |
122701 |
122704 |
122706 |
122709 |
122711 |
122713 |
122716 |
Viewing direction East |
|
|
|
|
|
|
|
|
|
Camera
direction |
Camera
number |
Flight
line |
Time stamp = image number |
|
|
|
|
|
Backward |
61005 |
26 |
121545 |
121542 |
121540 |
121538 |
121535 |
121533 |
121530 |
121528 |
121525 |
Forward |
61001 |
27 |
121939 |
121941 |
121943 |
121945 |
121947 |
121949 |
121952 |
121954 |
121956 |
Backward |
61005 |
28 |
122322 |
122320 |
122318 |
122316 |
122313 |
122311 |
122309 |
122306 |
122304 |
Viewing direction West |
|
|
|
|
|
|
|
|
|
Camera
direction |
Camera
number |
Flight
line |
Time stamp = image number |
|
|
|
|
|
Forward |
61001 |
26 |
121528 |
121525 |
121523 |
121521 |
121518 |
121516 |
121513 |
121511 |
121509 |
Backward |
61005 |
27 |
121954 |
121956 |
121959 |
122001 |
122003 |
122006 |
122008 |
122010 |
122012 |
Forward |
61001 |
28 |
122306 |
122304 |
122301 |
122259 |
122257 |
122254 |
122252 |
122250 |
122247 |
Viewing direction Nadir |
|
|
|
|
|
|
|
|
|
Camera
direction |
Camera
number |
Flight
line |
Time stamp = image number |
|
|
|
|
|
Nadir |
62056 |
26 |
121538 |
121535 |
121533 |
121530 |
121528 |
121525 |
121523 |
121521 |
121518 |
Nadir |
62056 |
27 |
121945 |
121947 |
121949 |
121952 |
121954 |
121956 |
121959 |
122001 |
122003 |
Nadir |
62056 |
28 |
122316 |
122313 |
122311 |
122309 |
122306 |
122304 |
122301 |
122259 |
122257 |
|
 |
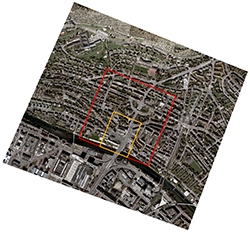
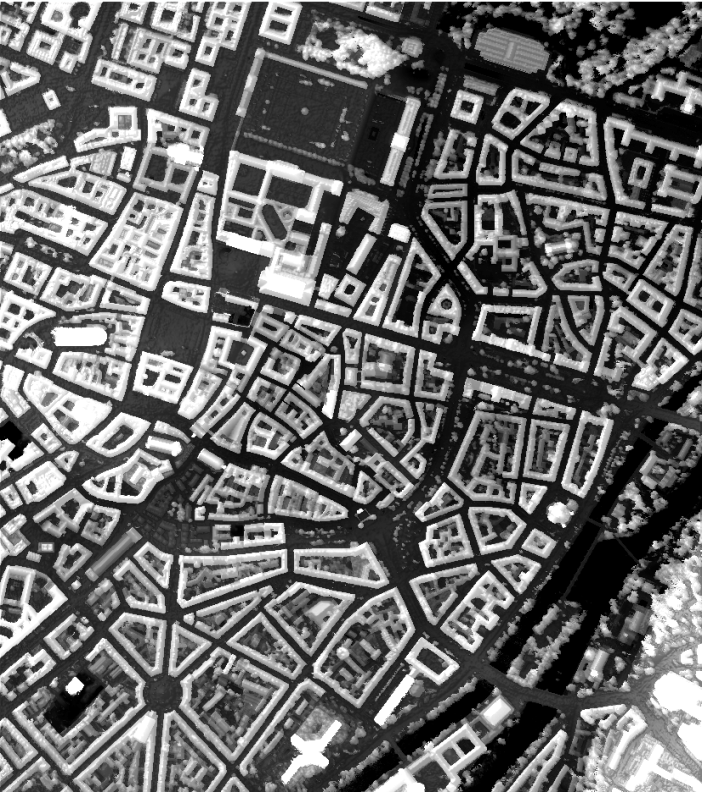
| Figure 2: Ortho image of test area |
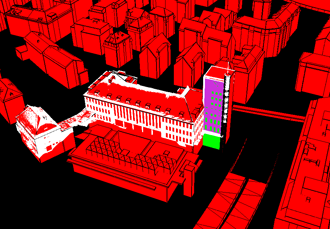
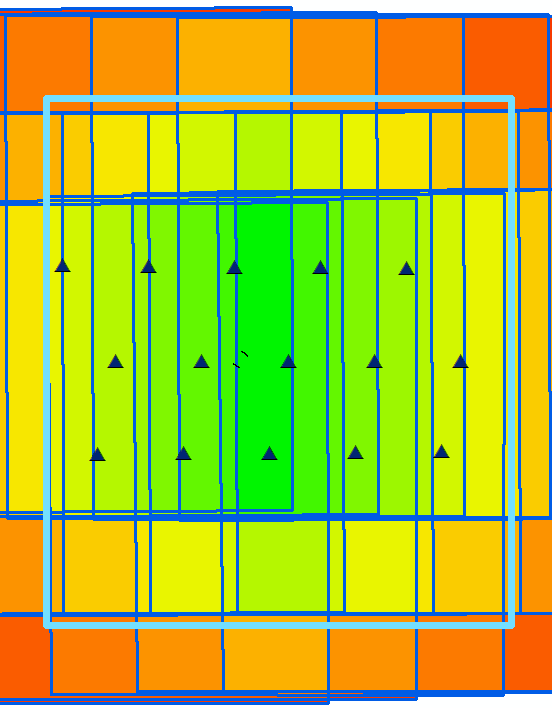
Figure 3: Exemplary point cloud overlaid to 3D city model. |
Figure 2 depicts the test area by a red rectangle as well as the area to be processed by an orange rectangle overlaid to an ortho image. A 3D city model for a section of this area is shown in figure 3 with an exemplary 3D point cloud additionally overlaid. During the benchmark such 3D point clouds will be used for evaluation of the matching results since they provide the most general output of dense multi-view image matching. Thus 3D point clouds have to be uploaded by the participants as LAS-Files for further analysis. During this evaluation a comparison to reference measurements from terrestrial LiDAR will be performed for a number of representative facades. Since terrestrial laser scanning is impossible for a large scene, the decision was taken to choose several distinct reference patches distributed over the whole test area.
Further information on the evaluation procedure can be found in the paper.
Cavegn, S., Haala, N., Nebiker, S., Rothermel, M. & Tutzauer, P., 2014. Benchmarking High Density Image Matching for Oblique Airborne Imagery. In: Int. Arch. Photogramm. Remote Sens. Spatial Inf. Sci., Zürich, Switzerland, Vol. XL-3, pp. 45-52.
Nadir Airborne Test Data Sets
The nadir airborne benchmark is a continuation of a test already implemented in the framework of EuroSDR in the year 2013. Parts of available results were presented and discussed during the 2nd EuroSDR workshop on 'High Density Image Matching for DSM Computation' June 13th to 14th 2013 at the Federal Office of Metrology and Surveying (BEV) in Vienna. Based on the outcome of the workshop, a report on the “Landscape of Dense Image Matching Algorithms” was compiled (see paper and presentation slides).
The nadir airborne benchmark features two data sets with different landuse and block geometry. Vaihingen/Enz is from an aerial image flight collected in a semi-rural area. Both ground sampling distance and image overlap are rather moderate, thus this data set is representative for statewide data collection. In contrast, the test data set München has a higher overlap and resolution and is more typical for applications in densely built-up urban area.
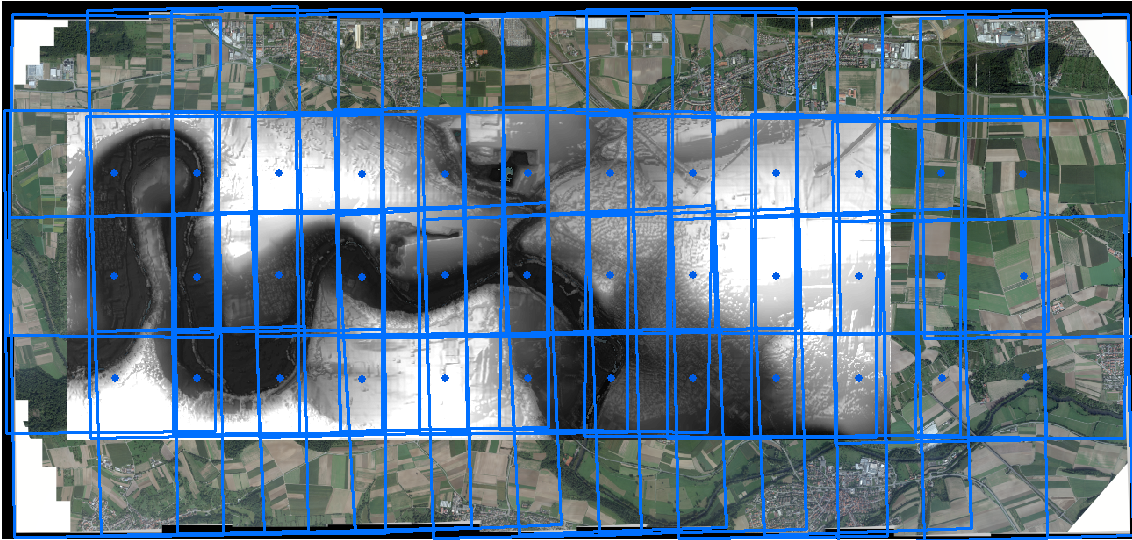 |
| Figure 4: Ortho image and reference DSM of test area Vaihingen/Enz with image footprints and camera stations of UltraCam-X 20cm GSD flight. |
The data set Vaihingen/Enz was captured by a UltraCam-X at height above ground of 2900m and a ground sampling distance (GSD) of 20 cm. Figure 4 shows the ortho image and the DSM of the test area. Image footprints and camera stations are additionally overlaid. The overall block consists of 3 strips with 12 images. Participants are required to generate a DSM for the central part with a size of 7.5kmx3.0km at a grid with of 0.2m. Details on the exact definition of the test area and the requested processing are given below.
 |
| Figure 5: Color-coded image overlap (maximum nine-folded) for test flight Vaihingen/Enz. |
Figure 5 represents the block configuration by a color coded map, with image footprints and camera stations again overlaid. As it is visible, the overlap of 63% in flight and 62% cross flight results in image overlap conditions from one-folded areas (red) to nine-folded overlap (dark green). For the the test area Vaihingen/Enz PAN images are made available as Tiled Tiff uncompressed 8 bit/pix with 9420x14430 pixel at a data volume of 180 Mbyte/image. On demand RGB images can additionally be made available as Tiled Tiff uncompressed 24 bit with 9420x14430 pixel at 537 Mbyte/image.
The data set München is provided by the Landesamt für Vermessung und Geoinformation Bayern (LVG) with support from the City of Munich and the Company Astec. While Vaihingen/Enz was selected as an example for nation-wide DSM generation at areas with varying landuse, the data set München is representative for densely built-up urban areas with complex 3D structures. For such applications, images are usually collected at higher resolution and overlap. As it is visible figure 6, the image sub-block to be processed consists of 3 image strips with 5 images each. This results in 80% in flight and 80% cross flight overlap, which provides up to fifteen-folded object points. The München data set covers a central part of the city and was captured by DMC II 230 at a GSD of 10cm. Each image has a size of 15552x14144 pixel at 16 bit/pix. In addition to the PAN images for image matching, again RGB images can be made available on demand i.e. for visualization purposes. The area to be processed has a size of 1.5x1.7km.
 |
 |
| Figure 6: München: Color-coded image overlap (maximum fifteen-folded) with image footprints and camera stations (left) and DSM (right). |
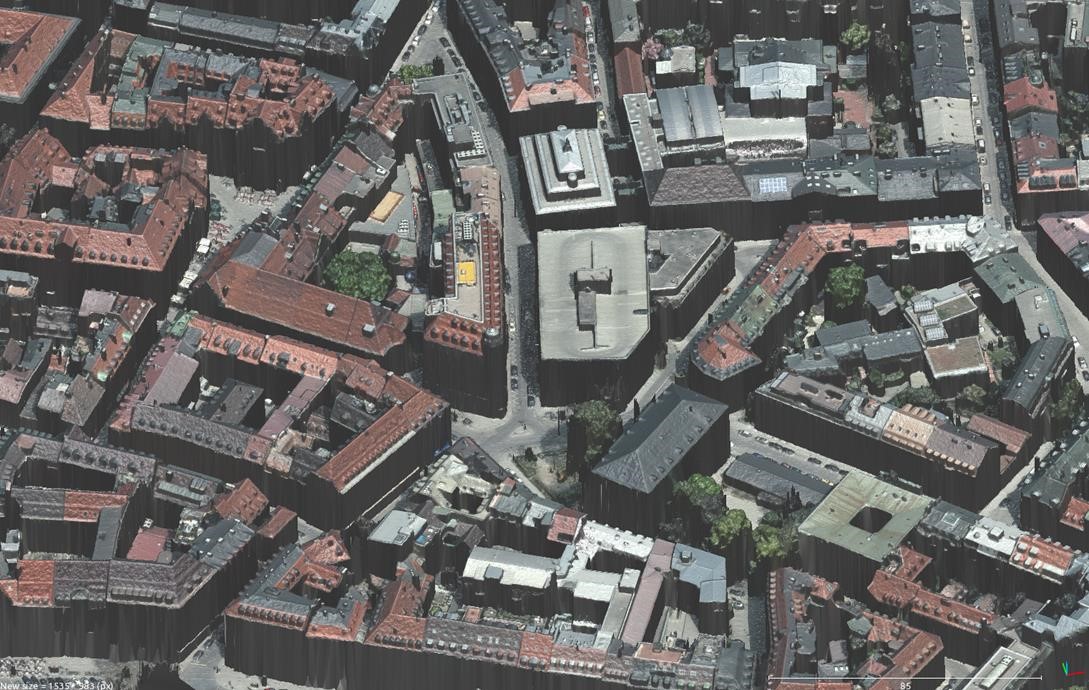 |
| Figure 7: 3D Visualisation of test area München. |
A DSM of the test area is shown in figure 6 (right), figure 7 additionally shows a 3D visualization the data set. As it is visible, the area is densely covered by buildings with heights of up to 50m. These buildings result in occlusions especially for surface parts close to the facades. Thus, visibility can be limited for such regions, which will potentially aggravate the matching processes during DSM generation.
Processing parameters and deliverables
General focus of the benchmark is the comparison of DSM quality as produced by different participants and/or software systems. To allow for comparable results of dense image matching, it is absolutely essential that all the processing is based on the same image orientation. Participants therefore should use the provided orientation, which is given as Inpho project file and individual orientation files with no modification. For each project corresponding image and ground coordinates are provided a file so the proper use of the transformations can be controlled by the participants on their own.
The camera orientation to be used as a common input is available here
In order to simplify the comparison of the results, the DSM generated from the test participants should be provided in the same geometry i.e. they should feature the same resolution and area as well as the same convention for pixel origin.
|
Area to be processed, pixel center |
Size of area |
Resolution |
Vaihingen |
Left: 491800
Bottom: 5418800 |
Right: 499300
Top: 5421800 |
37500x15000 pixel
7.5x3.0km |
0.2 m |
München |
Left: 4468200
Bottom: 5332500 |
Right: 4469700
Top: 5334200 |
15000x17000 pixel
1.5x1.7km |
0.1 m |
The results shall be provided by a raw Tiff image encoding with float values corresponding to the elevation in meters. For the pixel origin convention, we propose to adopt the so-called "pixel-center" convention, i.e. the pixel of coordinate (100,90) corresponds to the square [99.5,100.5] x [89.5,90.5] of continuous space. The predefined areas of interest for the respective data sets are given in the above table.
In addition to the DSM data the participants also should provide additional information on used hardware environment and time effort for processing of the benchmark data based on the delivered questionnaire.
Evaluation of test results
For the nadir benchmark the performance of the implemented algorithms is evaluated by analysis of a generated DSM raster. This DSM has to be produced by the respective participants in a predefined format. After deliverance to the project team, the difference to a reference DSM will be computed and made available again to the participant. In contrast, evaluation of the oblique benchmark is performed on 3D point clouds.
The nadir airborne benchmark is a continuation of a test already implemented in the framework of EuroSDR in the year 2013, thus results are already available from a number of participants. Software systems with respective DSM results, which were presented at the workshop were
- SocetSet 5.6 (NGATE) from BAE Systems
- Microsoft’s UltraMap V3.1.
- Match-T DSM 5.5 from Trimble/inpho
- ImageStation ISAE-Ext from GeoSystems
- Pixel Factory from Astrium
- DSM Tool from the Royal Military Academy (RMA) of Brussels
- Remote Sensing software package from Joanneum Research
- MicMac developed at IGN
- SURE from the Institute for Photogrammetry (IfP), University of Stuttgart
- FPGA implementation of SGM from the German Aerospace Center (DLR).
As a common reference surface, the results provided by the participants were used to generate a median DSM. Of course this median does not provide an independent ground truth. However, it can be used very well to illustrate differences between the respective solutions and thus give hints to situations which are potentially difficult for image matching.
As reference surfaces, two median DSMs were generated based on the results of the 10 participants with a cell width corresponding to the ground sampling distances. Although the reference DSMs are dependent on the DIM results, they are appropriate to highlight DIM differences.
 |
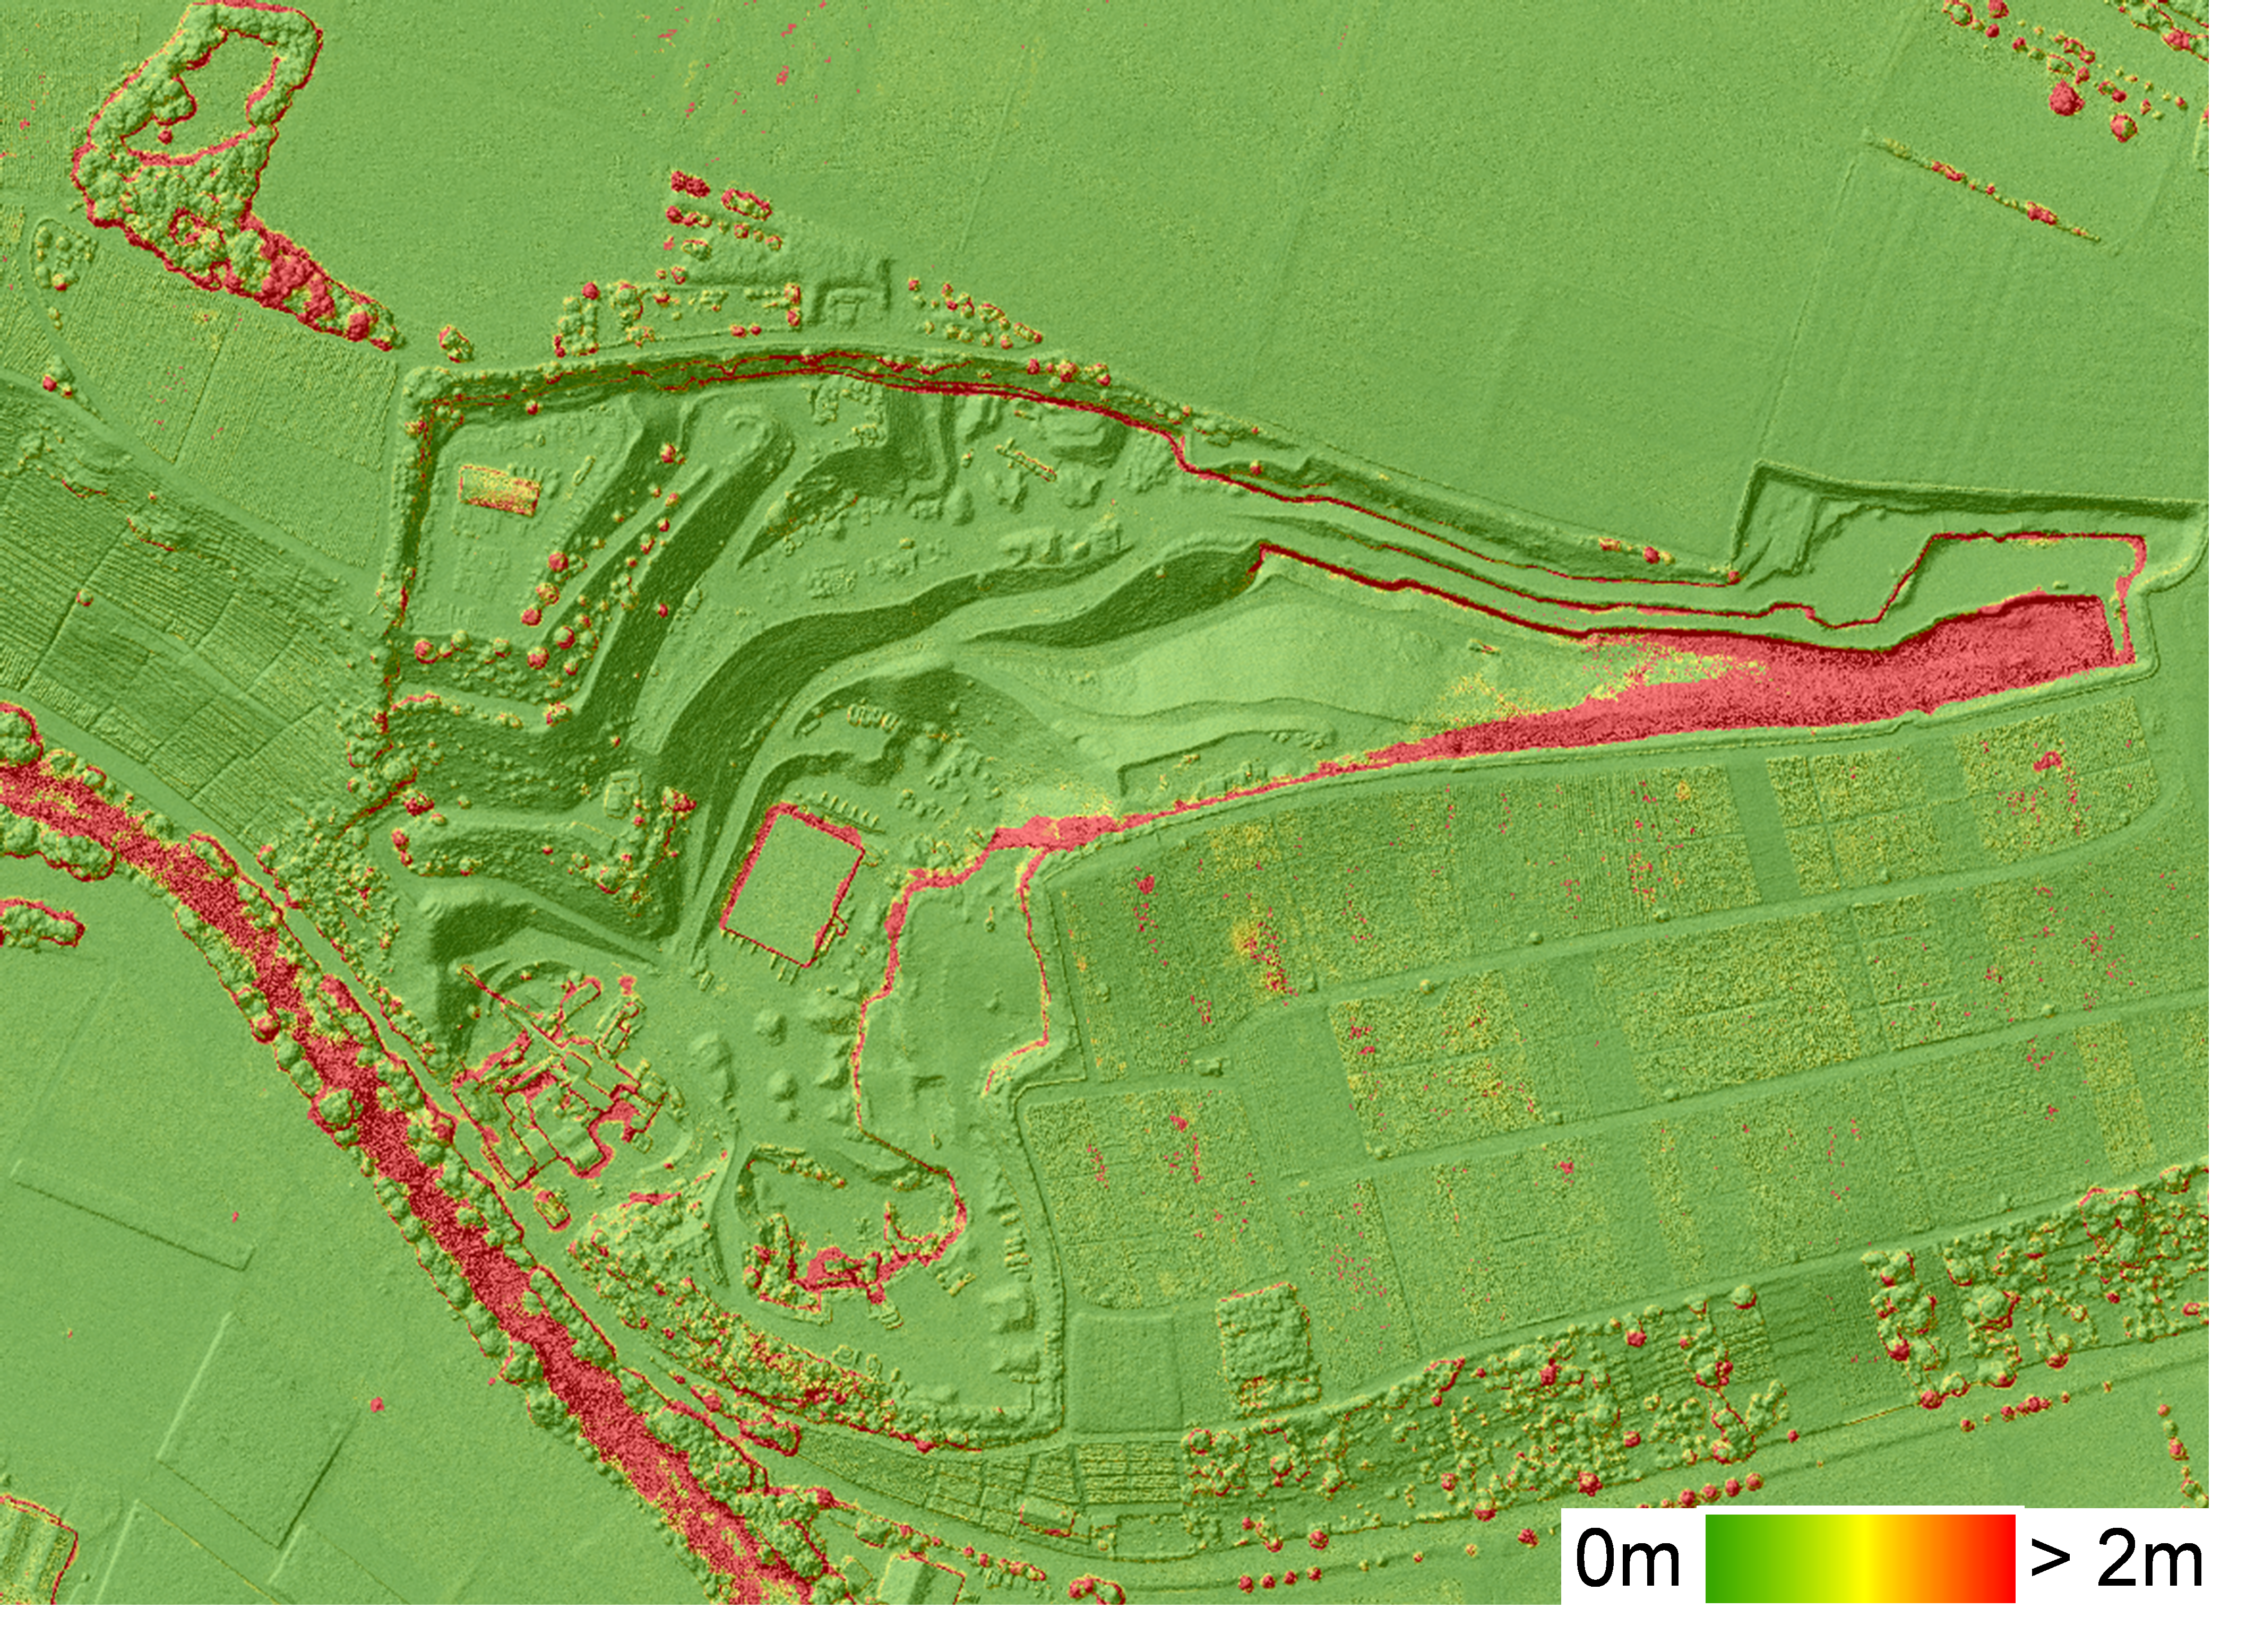 |
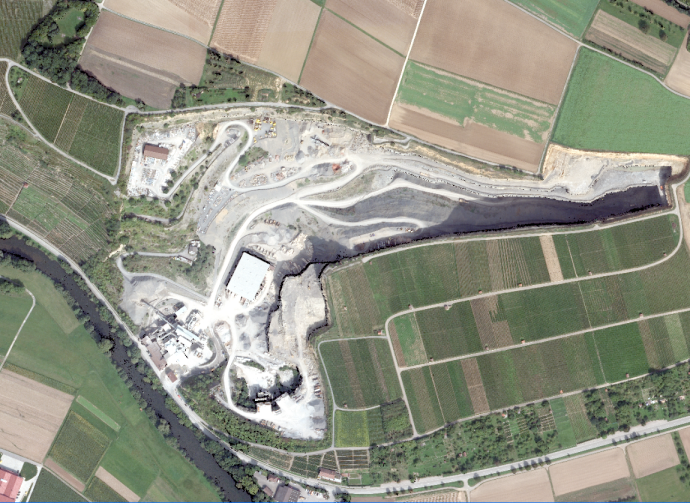
| Figure 8 Vaihingen/Enz: Ortho image and median DSM with RMS differences between the available solutions. |
Figure 8 shows a an ortho image and a shaded representation of this median for a part of the Vaihingen/Enz test area. A color map representing the root mean square differences of all DSMs with respect to this median is additionally overlaid. As it is visible, larger differences occur in the shaded area of the quarry, in the river area, in the vicinity of patches of trees and in the area of the vineyards. However, while comparing the individual results it becomes obvious that a number of software systems still provide consistent accuracies even for such situations.
 |
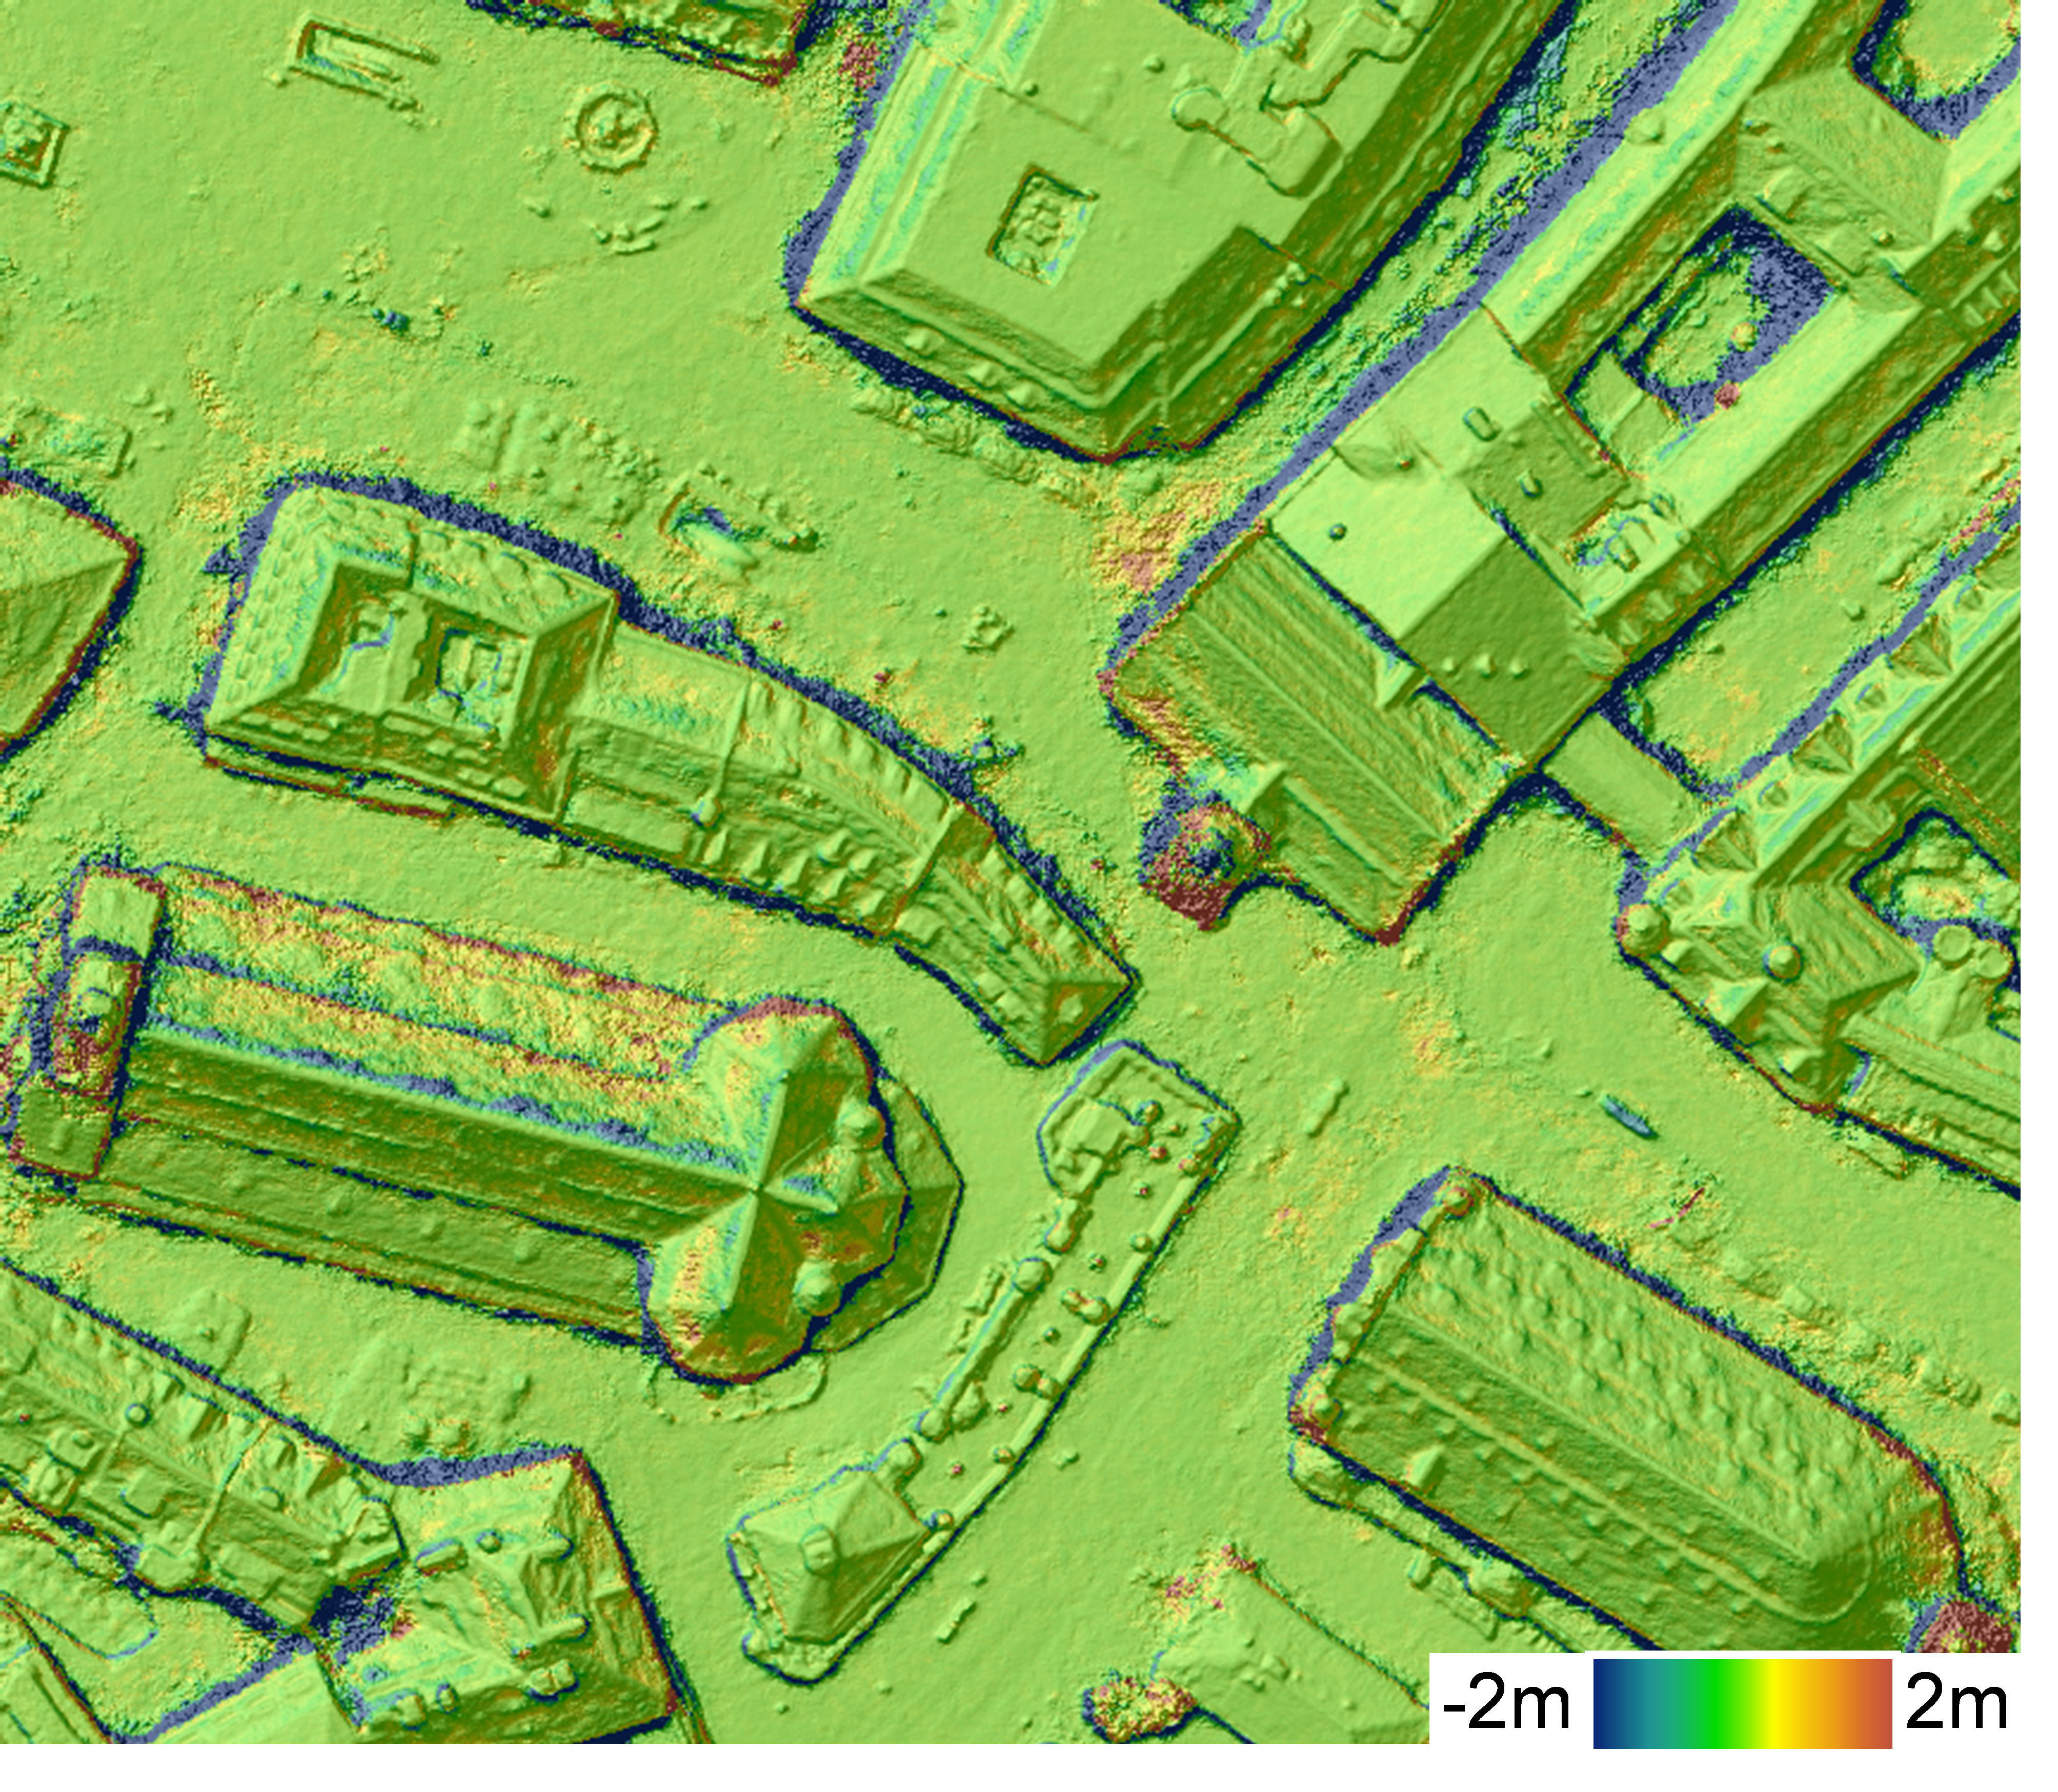 |
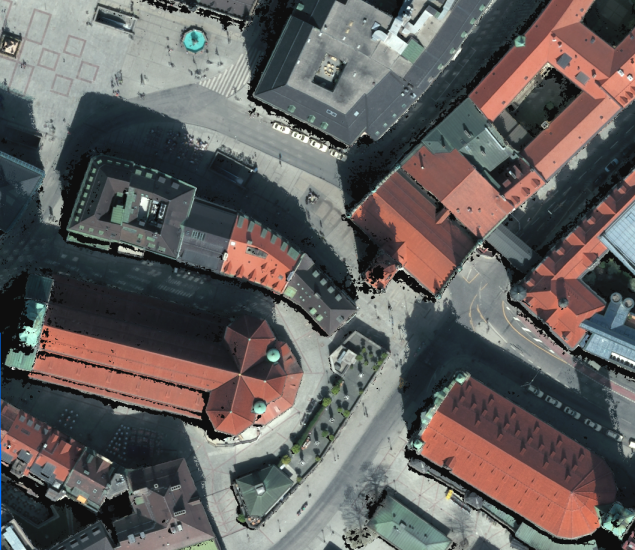
| Figure 9 München: Ortho image and median DSM with exemplary differences for one solution. |
Similarly, results for the test area München are presented in figure 9. For this example a color map representing the differences to the median DSM was generated from a single solution. Larger differences are mainly visible at small details and steep edges which occur in the vicinity of building borders. Furthermore, cast shadows seem to result in larger differences and increasing noise for the reconstructed surfaces.
While a considerable amount of results were already made available to the project team and have been used to compile these preliminary results, the benchmark data is still made available and can be applied to generate new outcome or improve already existing results.
Haala, N., 2014. Dense Image Matching Final Report. EuroSDR Publication Series, Official Publication No. 64, pp. 115-145. http://www.eurosdr.net/sites/default/files/uploaded_files/eurosdr_no64_c.pdf
2nd EuroSDR workshop on 'High Density Image Matching for DSM Computation http://geo.tuwien.ac.at/news/2nd-workshop-on-high-density-image-matching-for-dsm-computation-successfully-completed-2013-06-19/
Haala, N., 2013. The Landscape of Dense Image Matching Algorithms. In: D. Fritsch (Ed.), Photogrammetric Week ’13. Wichmann, Berlin/Offenbach, pp. 271-284. paper and presentation slides
Principals:
Prof. Dr. Norbert Haala
Stefan Cavegn
Institute for Photogrammetry, Universität Stuttgart |
Andy McGill
Ordnance Survey Ireland |
Prof. Dr. Stephan Nebiker
Institute of Geomatics Engineering, FHNW Muttenz |
Prof. Dr. Norbert Pfeifer
Department of Geodesy and Geoinformation, TU Wien |
Michael Franzen
Federal Office for Metrology and Surveying, Wien |
|